NDVI Classification: Understanding Vegetation Health for Better Crop Management
- NDVI helps assess vegetation state, where higher values indicate healthier crops.
- Proper NDVI analysis can help identify crop diseases, nutrient deficiencies, and other threats early on.
- NDVI data can be collected through satellites, drones, and local sensors.
- Regular data collection, visual checks, and comprehensive evaluation of information gathered via both satellites and field cameras helps to reach more accurate conclusions.
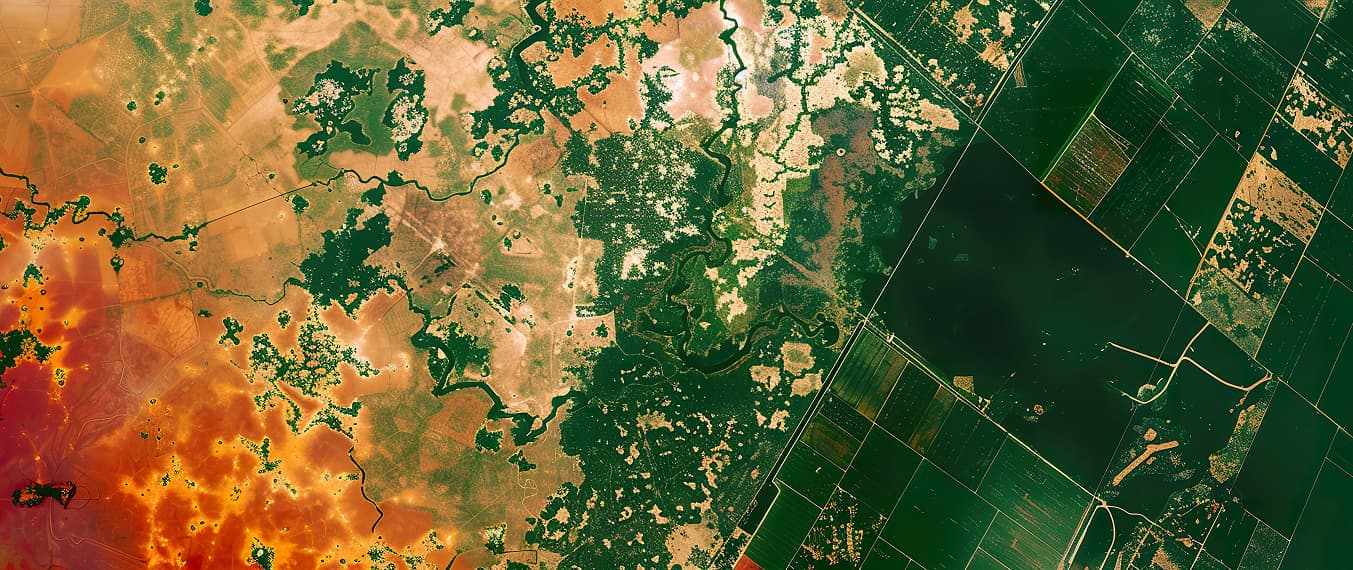
The Normalized Difference Vegetation Index (NDVI) is one of the most powerful tools you can use to assess your land and crop conditions. When integrated into a web platform for monitoring your fields, you can derive deep insights into the state of your crops.
By taking imagery focused on the red and near-infrared spectrum, it becomes easier to understand how well crops are growing. We've covered how NVDI works before, so in short: the chlorophyll in healthy plants tends to reflect near-infrared (NIR) light, while sickly plants tend to absorb NIR frequencies. In addition, the reflective properties will also reveal details about the condition of the soil, and even water levels.
In this article, we'll discuss practical applications of NDVI and how it can help you manage your fields more efficiently.
NDVI Value Ranges and Their Meaning
The NDVI scale runs from -1 to 1. The higher the number, the more NIR light is being reflected from the ground. So, generally speaking, the higher the NDVI value for your crops, the healthier they are likely to be.
There are a few generally-accepted ranges in the NDVI classification:
Examples of NDVI values: classification
Based on the values from the NDVI classification table, you can determine the health of individual crops, based on how their NIR reflectivity changes across their growth stages. The NDVI should increase steadily as a crop grows. It's very rare for a crop to reach an NDVI of 1.0, but ranges from 0.7 upwards almost always indicate healthy crops likely to produce a good yield.
Applications for NDVI Vegetation Classification in Agriculture
NDVI values can be used to improve your farm's productivity and efficiency in numerous ways — especially if they're combined with on-the-ground observation systems such as agricultural cameras from Cropler. Here is how knowing and tracking the dynamics of NDVI values can be useful.
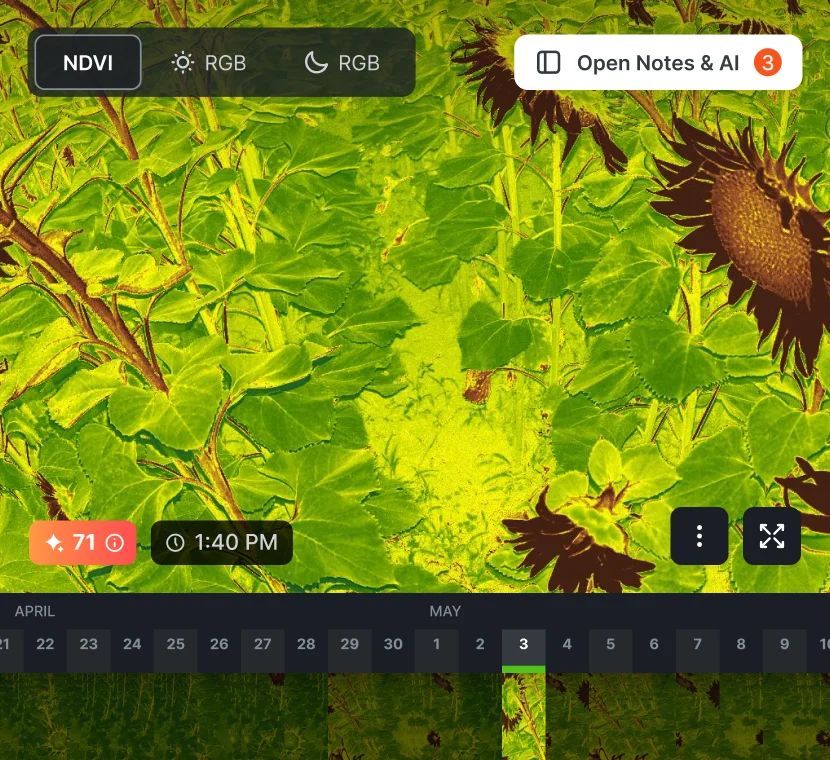
Crop Health Monitoring
Sickly plants will produce lower NDVI values than those that are healthy. So, for example, if you expect the field to be in the upper ranges according to the plants’ phenological stage, but it's in the 0.3-0.5 range instead, that would immediately suggest stressful conditions, the presence of diseases, or nutrient deficiencies. From there, the field can be directly observed to determine the exact cause of the problem.
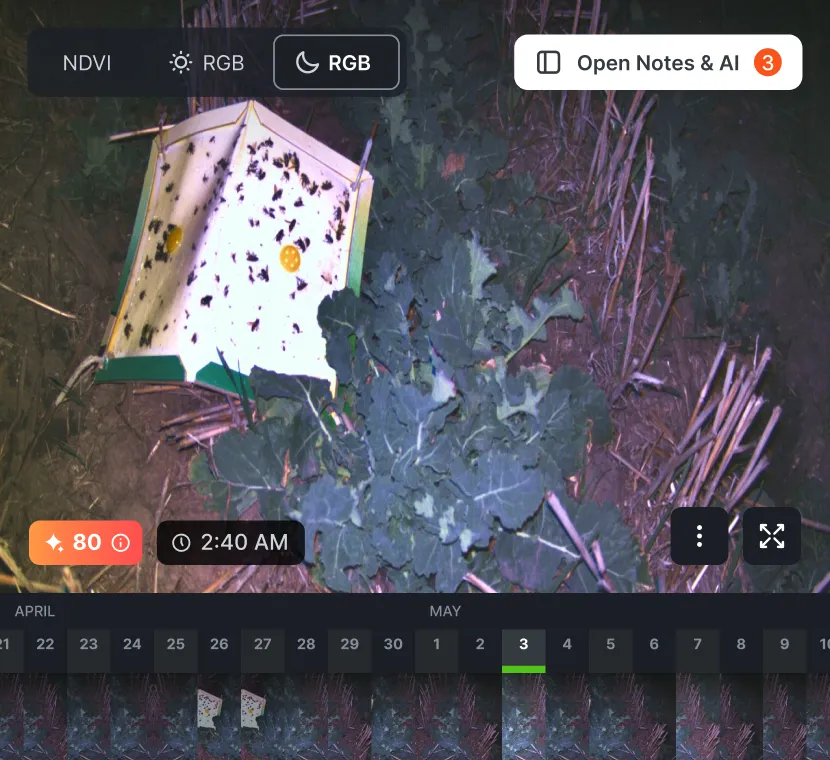
Pest Detection
Pests will also bring down NDVI values by directly damaging the leaves and impacting their NIR reflectivity. In the case of smaller pests who won't show up on cameras, the NDVI system might be your first early warning of pest infestation.
Irrigation Management
The presence of water will affect the NDVI value and can give insights into your fields' hydration. Drought-prone areas can be identified early, and your irrigation strategies can be updated to avoid problems before they happen.
Yield Prediction
Because NDVI values give a quick snapshot of a field's overall health, you can derive estimates of its yield based on those numbers. This becomes a particularly powerful tool when combined with other indices in an online dashboard that helps you track your crops' overall progress.
NDVI Classification Methods
When monitoring NDVI, it’s commonly recommended to combine different sources and approaches for higher accuracy. For example, you can use satellite data to detect problems and then refer to local sensors like Cropler to identify them more precisely. Also, using modern software for NDVI analysis helps to evaluate the health of your fields faster. Let’s discuss it in more detail.
Gathering the Data
Fundamentally, there are three ways of gathering the data needed for NDVI analysis:
- Satellites: Satellites often provide the best overview of a field, particularly over large areas. They are minimally affected by the weather, but not all of them can penetrate cloud cover. Also, accessing satellite data may require partnering with another company.
- Drones: For a DIY approach, drones can be equipped with infrared cameras and survey the field directly. You need drones and operators, but can remain in control of the process. However, don't try to use them in inclement weather.
- IoT monitoring: Remote monitoring systems on the ground can also provide NIR information — but these sensors cover smaller areas, so it’s better to use them along with satellites.
Analyzing the Data
NDVI data requires expert knowledge — or significant computational power — to be most useful.
An expert can look at NDVI values and quickly understand the state of a field. Bringing a human's knowledge and insight, they can also find factors that would slip past automated systems. This is particularly useful when focusing on a very particular field, crop, or other isolated problem.
However, human analysis tends to be slow, and the quality of the analysis directly relates to the expertise of the person. For larger projects, data analysis and algorithmic systems are typically used. Computers can crunch through vast amounts of NDVI values and other climate data to arrive at statistically valid insights into the land.
This is faster, and often best when you need a wide overview rather than a highly-granular analysis. But computers are only as good as the data they're fed, they have no ability to do a "reality check," so it’s important to choose credible sources.
Challenges and Limitations
Beyond the challenges in interpreting NDVI data, there are other factors to be aware of:
- Atmospheric Interference: While satellites are sometimes good at punching through the atmosphere, pollution can foul the readings.
- Weather: Excessive precipitation can confuse NDVI data collection, especially if standing water is left after a storm. Too much water will lower NIR reflectivity.
- Sensor Differences: Despite attempts at standardization, all sensors will be calibrated a little differently. Gather plenty of test data to develop a baseline for your sensors' performance.Mechanical Issues: Keep up with maintenance, or else your sensors and imaging systems could provide false data.
Practical Tips for Farmers and Agronomists
As a few more suggestions:
- Don't over-rely on NDVI information alone. It's best combined with other sources of data, such as rain sensors and crop monitoring systems, to create a full picture.
- Use standard color conversion laid onto maps to make the data easier to digest. It's common to use red to indicate low NDVI, and green for high/healthy NDVI.
- Have a set timeframe for capturing data, such as once a week, so the data remains consistent.
- Always do reality checks! Don't rely entirely on external data; visually observe the crops to ensure validity.
When you have questions, we'll help you find the answers you need to take control of your fields and the harvest you care about. Contact Cropler to discover more about our products and the ways we help you proactively protect your operations from the effects of crop diseases. Learn More
For more options in monitoring your fields, capturing data, and making the best use of it, use Cropler! With portable agri-cameras and a smart web platform, our mission is to make high-tech, cloud-based, AI-powered crop analysis systems available to farms of all sizes.
Click here to learn about our system, or contact us for more information.


